
Player: Shooting, Overall
The "Shooting: Overall" table gives you a high level look at how a player shot the ball with eFG%, basic two-point, three-point and free throw percentages, and ASTD% (broken into broad locations). Let's look at each of these in order.
eFG%click to show/hide
Let's say Rudy Gobert shoots 3 for 6 from the field, all two point shots, and Steph Curry shoots 2 for 6 from the field, all three point shots. According to regular field-goal percentage (FG%), Gobert shot 50% and Steph shot 33% — Gobert seems far more efficient. But they both scored 6 points on 6 shots! That's a problem. We want a stat that corrects for this and shows them shooting the same, since they did. Effective field goal percentage corrects this flaw in FG% by including the extra added value of three-pointers. This stat answers the question: if we account for the added value of three-point shots, what did the player effectively shoot from two-point range? In the example both players shot 50% eFG% — they both effectively shot 50% from two.
eFG% is similar to PSA (in the Offensive Overview table) in that they both measure points scored per shot attempt. PSA, however, includes points scored from the foul line. eFG% shows you the player's efficiency just on field goal attempts. That means you can compare eFG% percentiles and PSA percentiles and see how much efficiency the player is gaining or losing relative to his peers from the foul line.
The Gritty Details
eFG% is calculated by simply counting made threes as worth 1.5 times as much as made twos (since three-pointers are worth 1.5 times as much as two-pointers). CTG removes heaves (estimated from play-by-play by looking at shots taken from far distance and at the end of the shot/game clock) from these numbers for player stats.
eFG% = (two pointers + 1.5 * three pointers) / field goal attempts
2P%, 3P%, FT%click to show/hide
These stats are fairly straightforward: two-point percentage is FG% on two-point shots, three-point percentage is FG% on three-point shots, and FT% is percentage of free throws made. This is a good first place to look when trying to determine why a player's shooting percentages went up or down in a given year. It allows you to take a glance and see where you might want to dig deeper.
The Gritty Details
Nothing too gritty here!
ASTD%click to show/hide
Assisted rate tells you how many of a player's made field goals were assisted. CTG breaks this down into locations: all shots, shots at the rim, shots in midrange, and threes. Note that since an assist is only awarded on a made shot, this doesn't tell us how many of a player's shots came off the pass — just his makes. Still, it can be a reasonable way to see how often a player is playing off the pass vs. the dribble.
Note that being assisted more or less isn't necessarily better or worse, but for the purposes of the percentiles CTG says being assisted less often is better (higher number and more blue), since shot creation off the dribble seems to be a rarer and more valued skill. But this should be taken with a grain of salt since it is far from true in all cases.
Example: Giannis Antetokounmpo
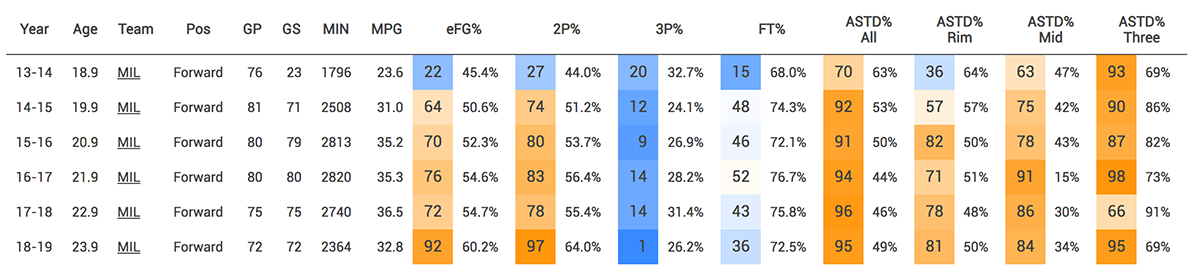
In general, Giannis plays off the pass much less than other forwards. Less than 50% of his made shots were assisted in the last three years in this table. Interestingly, despite being a poor three point shooter, Giannis has taken a high rate of threes off the dribble. We can see from this table that in 2018-19, just 69% of his made threes were assisted. That was a lower rate than 95% of all forwards, and a big drop from the prior season where 91% of his made threes were assisted. Giannis clearly took many more threes off the dribble in 2018-19.
The Gritty Details
This stat simply takes assisted made field goals and divides it by all made field goals.