
League: Summary
The "Summary" table is the best way to quickly get a read on what the league looks like at any given moment and why. It shows each team's efficiency differential (a good measure of team quality), as well as their points per possession for both sides of the ball — both for the full season and in the last two weeks.
For more on understanding "efficiency differential" and "points per possession" stats, see the Four Factors table guide.
By default, all of the stats on this page exclude garbage time.
Expected Wins (Exp W & Exp W82)click to show/hide
What are expected wins? Think of them like this: We can look through history and see how many games teams with various efficiency differentials tend to win. With that and a little bit of math (see the gritty details below) we get a number that tells us how many games we'd expect a team to win based on their efficiency differential.
That's useful because it helps account for teams who win a disproportionate number of close games. Early in the season in particular, point differential is a much better indicator of future performance than games won. So expected wins cuts through that noise and tells you: if we only were to look at the team's differential, how good would we think they are?
Exp W82 is the same as expected wins, just on an 82 game basis. When the season is done, these numbers will be the same. But, say the team has only played 41 games and has an expected win percentage of 55%. Exp W will be 22.55, since we're saying that this team, at this point in the season, should have won around 22 or 23 games based on their point differential. Exp W82 will be 45.1, telling us that a team with this point differential would be expected to win 45 games over an 82 game season.
Example: 2018-19 Top 10 teams
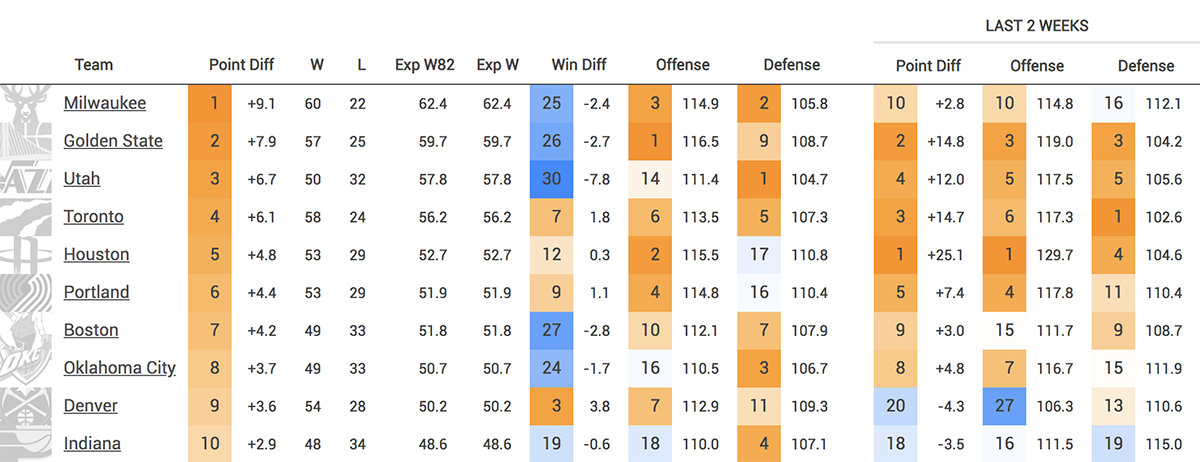
Based on their point differential, we would have expected the Warriors to have won 60 games. They actually won 57. Based on Houston's point differential, we would have expected them to have won 53 games—which is exactly what happened!
The Gritty Details
CTG uses Pythagorean win expectation to determine how many wins would be expected of a team with a certain efficiency differential. (CTG uses an exponent of 14.)
Win Differential (Win Diff)click to show/hide
Once we have a team's expected wins, we can then compare how many games any given team actually won to how many we'd expect them to win given their differential. The difference between actual wins and expected wins is what CTG calls win differential.
Why would a team's actual wins deviate from what we'd expect given their point differential? Because of different margins of victory in wins and losses. For example, let's say the Celtics play 10 games, and win 8 of them by 3 points each, but lose 2 of them by 12 points each. They would have a +0 point differential, meaning we'd have expected them to have gone 5-5, but they would have been 8-2 in this stretch instead.
Research has tended to show that performance in close games is more random than most people expect. Using that Celtics example, we probably wouldn't expect a team like that to go undefeated in close games going forward. Very good teams, meanwhile, often win by big margins. Efficiency differential, then, particularly over 10 games, is probably a better measure of team quality than wins and losses. As Daryl Morey once said: "Good teams don’t win close games — they avoid them."
But, over a large sample, performance in close games also doesn't seem to be completely random, as Benjamin Morris has noted. That means if a team's wins are vastly different from what we'd expect, it could be due to good or bad luck, but it could also be due to performance in close games or a higher-than-normal frequency of getting blown out (or blowing teams out). This is particularly true over larger samples.
Example: 2018-19 Top 10 teams
This table shows that most of the top 10 teams ended up winning within 3 games in either direction of what their efficiency differential would have predicted. The major outliers were Utah and Denver. The Jazz won 50 games, but their efficiency differential was +6.7. The Win Diff column shows -7.8, meaning that the Jazz won 7.8 fewer games than expected based on that +6.7 efficiency differential. In other words, an average team with a +6.7 efficiency differential would have won around 58 games.
The Nuggets, meanwhile, were on the opposite end of the spectrum. They had a point differential that normally would have resulted in a team winning around 50 games, but instead they won 54 — the difference between the #2 seed in the West and the #5 seed.
The Gritty Details
CTG uses Pythagorean win expectation to determine how many wins would be expected of a team with a certain efficiency differential. (CTG uses an exponent of 14.)