
League: Four Factors
The "Four Factors" table is the best way to understand each team's strengths and weaknesses at a glance. It shows a team's efficiency differential (a good measure of team quality), as well as their points per possession and Dean Oliver's Four Factors for both sides of the ball. This table not only tells you who is playing well or poorly, but importantly it tells you a lot about why.
Studying this table over time can also be very informative about the way the league works as a whole. While each of the Factors help you measure a team in a different way, all of them are connected, sometimes in unanticipated ways. For example, I wrote previously about how you can use these numbers to see how unique the style of defense the Milwaukee Bucks have played under Jason Kidd is — and that these numbers tell us some interesting things about what has succeeded or failed in the league over time.
Below we'll walk through the important columns in this table, with some brief notes on how to think about the Four Factors in general. By default, all of the stats on this page exclude garbage time.
Overall Efficiency (Pts/Poss)click to show/hide
In basketball, a possession starts when a team gets the ball and ends when they lose the ball (or the quarter ends). This leads to an important fact: when two teams play each other, they are guaranteed to have the same number of possessions (with the important exception of the last possession of a quarter). Which means that the best way to compare two teams is on a per-possession basis.
Why? Take a team that plays at a very fast pace and compare it to team that plays at an incredibly slow pace. If we look at what they do per game, we'll be fooled. The fast team gets many more possessions per game than the slow team. But when those teams play each other, they are guaranteed virtually the same number of possessions. So it doesn't matter what they do per game — only per possession.
Imagine if teams in the East played 24 minute games and teams in the West played 48 minute games. We'd never compare what these teams do per game — we'd know that would be silly, since if the teams ever played each other they would, of course, have to play the same number of minutes. It's the same thing with possessions.
That's why we measure a team's offensive and defensive abilities by their points scored or allowed per possession. (CTG displays these stats per 100 possessions so that they're a little easier to read.) You may hear these stats referred to by different names: offensive/defensive efficiency, offensive/defensive rating (ORtg/DRtg), or offensive/defensive efficiency rating (OER/DER), among others. They all mean the same thing: points scored per 100 possessions.
Example: 2018-19 Top 10 teams
These Pts/Poss columns, one for offense and one for defense, are the first step in answering the question of how a team plays. How good are they overall on offense and how good are they overall on defense?
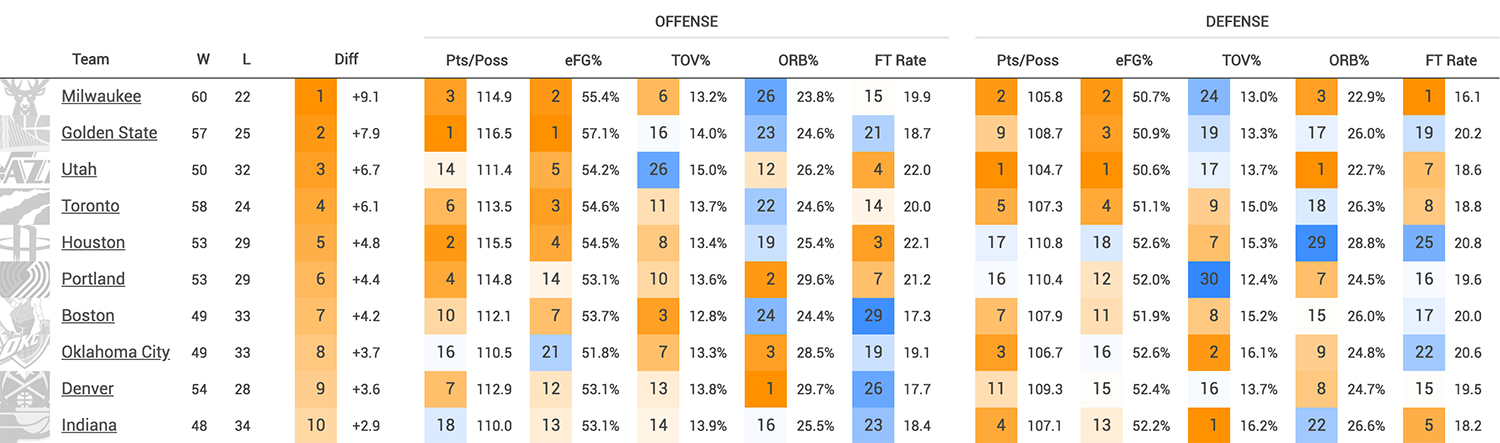
You can see that the Warriors had the #1 offense in the league, scoring 116.5 points per 100 possessions played. They also had the #9 defense, allowing 108.7 points per 100 possessions played.
You can also clearly see the outliers. The Jazz had the 3rd best point differential while ranking just 14th on offense because they had the league's #1 defense. Houston and Portland, meanwhile, both stand out as having below average defenses but still ranking in the top 10 in point differential. They were able to manage that because of their top 5 rankings on offense.
The Gritty Details
Possessions are counted directly from the play-by-play: they start when a team gains possession and ends when they lose it. There is some trickiness with dealing with the end of quarters — what happens if a team gains possession with 2 seconds on the clock and just has to inbound and heave it? That shouldn't count as a full possession. CTG counts those possessions differently, and by default does not include them in this summary.
Free throws from technical fouls (not counting Defensive Three Seconds violations) are not included in points per possession stats.
Efficiency Differential (Diff)click to show/hide
As mentioned above, measuring a team's offense and defense should be done on a per-possession basis. From there, it's not a big leap to say that a team's efficiency differential is a great measure of the quality of that team. Efficiency differential simply takes a team's points scored per possession and subtracts their points allowed per possession. (CTG multiplies this by 100 to make it easier to read.)
Example: 2018-19 Top 10 teams
You can see the top 10 teams by efficiency differential tracks pretty well with the team's actual wins. Milwaukee led the pack by outscoring their opponents by 9.1 points per 100 possessions played, while the Warriors had the second best differential at +7.9 per 100 possessions.
The Gritty Details
Efficiency differential is simply points scored per 100 possessions minus points allowed per 100 possessions.
The Four Factorsclick to show/hide
By looking at basketball on a per-possession basis, we also get another benefit: there are only four ways for teams to increase or decrease the points they score on a per possession basis. These Four Factors (as coined by Dean Oliver) give us a simple-yet-powerful way to further break down a team. They are, in order of most important to least:
- Shooting: teams can score more per possession by increasing the points they score per field goal attempted. This is measured with effective field goal percentage (abbreviated eFG%).
- Turnovers: teams can score more by not turning the ball over. If a team doesn't turn it over on a possession that means they get a shot at the basket, and more shots = more points. This is measured with turnover percentage (abbreviated TOV% or TO%).
- Offensive Rebounding: teams can score more by extending possessions by rebounding their own misses. An offensive rebound keeps a possession alive and gives the team more opportunities to score. This is measured with offensive rebounding percentages (abbreviated OREB% or OR%).
- Free Throws: teams can score more by getting to the free throw line and converting their opportunities there. This is measured using free throw rate (abbreviated FT Rate or FTR).
As noted above, these factors can be looked at independently, but they all are interconnected. Offensive rebounds frequently lead to high-percentage looks, so teams that offensive rebound better might have better shooting numbers. And, as noted in my Milwaukee Bucks article, there seems to be a tradeoff between shot quality and turnovers.
Overall, this relatively simply framework can tell you a lot about how teams play and what their strengths and weaknesses are. More about each specific stat is below.
Example: 2018-19 Top 10 teams
Styles of teams start to become very clear as you look at this table. The Warriors' offensive success is based all around their incredible shooting efficiency (eFG%): they are #1 by a large margin in this category. That's why their overall offense is #1 despite not ranking above average in any of the three other factors (turnovers, offensive rebounding, or free throws). The Blazers, on the other hand, were kind of the opposite: their eFG% ranked 14th last year but they had the 4th ranked offense because they were 10th in taking care of the ball, 2nd in offensive rebounding and 7th in scoring from the foul line.
Milwaukee's #2 ranked defense was based on an extreme (but proven) style: they ranked 24th in forcing turnovers but 2nd in shot defense (eFG%), 3rd in defensive rebounding, and 1st in preventing opponents from scoring from the line. The Jazz played a similar style. Houston's below-average defense, meanwhile, was mostly based around forcing turnovers—their shot defense ranked 18th, their defensive rebounding ranked 29th, and their opponent free throw rate ranked 25th.
Shooting: eFG%click to show/hide
Let's say San Antonio shoots 3 for 6 from the field, all two point shots, and Golden State shoots 2 for 6 from the field, all three point shots. According to regular field-goal percentage (FG%), the Spurs shot 50% and the Warriors shot 33% — San Antonio seems far more efficient. But they both scored 6 points on 6 shots! That's a problem. We want a stat that corrects for this and shows them shooting the same, since they did. Effective field goal percentage corrects this flaw in FG% by including the extra added value of three-pointers. This stat answers the question: if we account for the added value of three-point shots, what did the team effectively shoot from two-point range? In the example both teams shot 50% eFG% — they both effectively shot 50% from two.
Simply, eFG% tells us: how many points did this team score per field goal attempt? That's why it's used to measure shooting in the Four Factors. (For defense, we just look at opponent eFG%.)
The Gritty Details
eFG% is calculated by simply counting made threes as worth 1.5 times as much as made twos (since three-pointers are worth 1.5 times as much as two-pointers).
eFG% = (two pointers + 1.5 * three pointers) / field goal attempts
Turnovers: TOV%click to show/hide
As noted in the Pts/Poss section, we want to compare teams per-possession. To measure a team's turnovers we simply look at their turnovers committed per possession. That gives us their turnover percentage. (For defense, we just look at opponent TOV%.)
The Gritty Details
Turnover percentage is turnovers divided by possessions.
Rebounding: OREB%click to show/hide
One of the most frequent mistakes made when analyzing team stats is looking at rebounds without looking at missed shots. The only time a team can get a rebound is on a missed field goal or a missed free throw (which is the last of a set of free throws). So when we measure how good a team is at rebounding, we have to take into account how many opportunities they had to get one. Otherwise a team that is great at forcing missed shots will look like a better rebounding team than they are. Yeah, the team got more rebounds, but there were more misses!
The Warriors in 2016-17 were a great example of this: they ranked 3rd in defensive rebounds per game, but they actually ranked 26th in opponent offensive rebounding percentage. The difference is because the Warriors were elite in shot defense — they forced a ton of misses, so their total defensive rebounds was high. But per missed shot, they actually were poor on the defensive glass.
That's what rebounding percentages help correct: we simply look at how often a team got a rebound per opportunity they had to get one. For offense we look at how many offensive rebounds were collected per opportunity, for defense we look at how many offensive rebounds opponents collected per opportunity.
The Gritty Details
Offensive rebound percentage measures offensive rebounds per missed field goal or reboundable missed free throw. CTG counts this from play-by-play and includes team rebounds from reboundable misses. Note that many other places estimate this from the box score, which can be tricky because not all rebounds are secured by players — a ball that tips off a player's hand and goes out of bounds, for example, is credited as a team rebound. But missed free throws that are not reboundable (e.g. the first of two free throws) are also credited as team offensive rebounds by the NBA. This makes it impossible to get completely accurate numbers from box score stats. By pulling stats from play-by-play, CTG corrects for this issue.
Free Throws: FT Rateclick to show/hide
To measure how well a team is scoring from the foul line, CTG uses free throw rate: free throws made per field goal attempt.
The Gritty Details
It's just that simple: free throw rate = FTM / FGA.