
Games
The Games page displays all of the NBA games played on any given date, with a game card for each. Clicking a game card will take you to more statistical detail on that game. But each card itself also has important information about the game: points scored, possessions, points scored per possession, and the four factors for each team. For more on what these stats mean and why we use them, see the Efficiency and Four Factors guide.
Game Cardclick to show/hide
The game card is meant to give you a quick glance at the game to let you understand not only what happened, but (some of) why it happened. You'll eventually want more detail, which you can get by clicking the game card, but the card should give you a high level overview.
The card tells you how each team performed on a per possession basis along with the four factors. And importantly, the big orange/blue percentiles tell you what those stats mean by comparing them to all other games played in that season. So a 90 in the Pts/Poss column, for example, means that if we look at every other team performance in every game that year, 90% of them scored fewer points per possession than this team did. This makes it really easy to look at the game and see what each team did well and what each did poorly.
Example: 12/23/16 SAC @ MIN
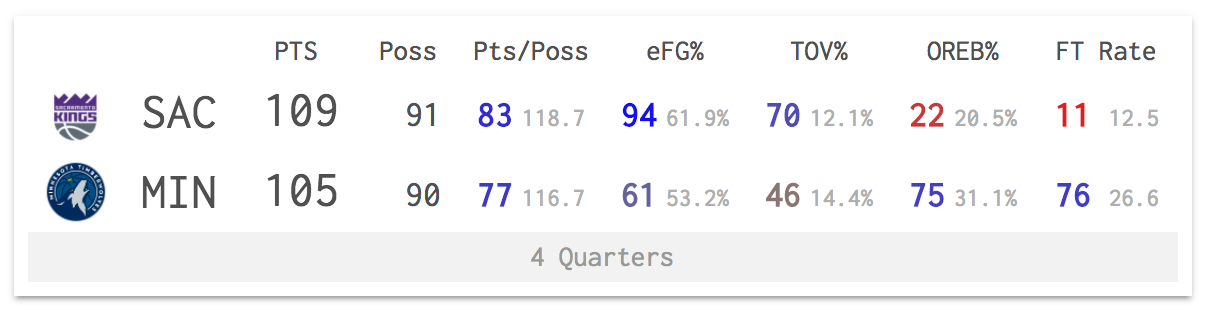
We can quickly see that Sacramento won the game in regulation, 109-105. The league average points per game in 2016-17 was just over 105 points per game, so that may seem like a slightly above average scoring game — but the game was only around 90 possessions, so looking at the game that way would be wrong, which we can see by looking at the Pts/Poss column. It turns out that both teams actually were quite efficient on offense: Sacramento's Pts/Poss was on the 83rd percentile at 118.7, and Minnesota's was on the 77th percentile. That's a pretty efficient game!
In Sacramento's case we can see that this was due to fantastic shooting (an eFG% on the 94th percentile) and a strong job taking care of the ball (turnover rate on the 70th percentile), which more than made up for poor offensive rebounding (22nd percentile) and very few free throws (11th percentile). Minnesota, meanwhile, shot the ball decently (61st percentile) without too many turnovers (46th), while throwing in strong offensive rebounding (75th) and a fair amount of scoring from the foul line (76th).
The Gritty Details
These stats include any garbage time played in the game as well as possessions that start with a few seconds left in the quarter that we'd expect to be heaves. The stats on the individual game pages themselves do not include these, to better represent what happened in the game, but since this is just a high level overview it makes sense to have them match the overall game totals.