
Player: Foul Drawing
The "Foul Drawing" table gives you a sense of how a player gets to and scores from the line with three stats: SFLD%, FFLD%, and AND1%. Note that who drew the foul was not recorded by the NBA until 2005, so prior to that season these stats will be blank.
SFLD%click to show/hide
Shooting fouled percentage measures how often the player draws fouls on their shot attempts. Note that this will be dependent on where the player typically shoots from: jump shooters will draw fewer shooting fouls than those that attack the rim.
Example: Giannis Antetokounmpo
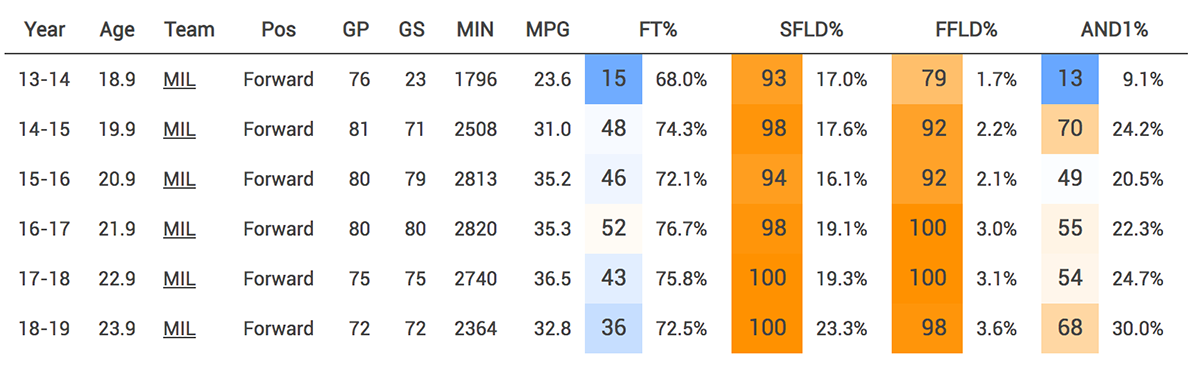
Giannis has been an elite foul drawer over his whole career. In his rookie season he ranked on the 93rd percentile in rate of shooting fouls drawn. Part of that may have been teams willing to foul him given his 68% FT%, but as his free throw percentage improved he has continued to draw more fouls. In 2018-19, his MVP year, he drew a shooting foul in nearly 1 in every 4 shot attempts, the highest rate of any forward.
The Gritty Details
Shooting fouled percentage takes all times the player is shooting fouled and divides it by the player's field goal attempts + shooting fouls drawn (making sure not to double count and-ones).
FFLD%click to show/hide
Floor fouled percentage measures how often the player drew non-shooting fouls (i.e. fouls on the floor). This number shows what percentage of his team's plays the player drew a non-shooting foul on. This is often related to how much the player has the ball, since players with the ball are much more likely to draw non-shooting fouls. But players who are more physical (say, going for rebounds) or attack more off the dribble will have higher rates than those that don't.
Example: Giannis Antetokounmpo
Giannis also drew a high rate of fouls on the floor as a rookie, even though he didn't have the ball that much. As his role on offense grew, so did his ability to draw fouls that weren't in the act of shooting. From 2016-17 and on he has basically been the best forward in the league at drawing non-shooting fouls.
The Gritty Details
Floor fouled percentage is floor fouls drawn divided by team plays when the player was on the court. A team play is a field goal attempt, turnover, or trip to the foul line.
AND1%click to show/hide
And-one percentage measures how often the player made the shot while drawing a shooting foul. This is not a stat that swings your analysis of a player by much, but it does help give a sense of how many of the player's drawn shooting fouls are also recorded as made shots.
Example: Giannis Antetokounmpo
In his rookie year, Giannis really struggled to convert shots where he was fouled, with an AND1% of just 9%. That may have been a result of his lack of strength. Since that point he has been solid at converting his fouled shooting attempts into and-ones. In his 2018-19 MVP season, he hit his highest rate of his career.
The Gritty Details
And-one percentage takes and-ones (when a player makes the shot and is fouled, resulting in being awarded one free throw) and divides that by the player's total shooting fouls drawn.