
Game Detail: Player Stats
The player stats on the game pages display some basic stats along with some of the player advanced stats seen elsewhere on the site. The percentiles compare the player's stats in this game to the stats from all other games that season played by players at the same position grouping (point/combo/wing/forward/big) with more than 5 minutes played in a game. So a 90 in the usage column for a point guard means that if we look at all other games played by points where they were in the game for more than 5 minutes, 90% of them had a lower usage than this player did in this game.
The stat explanations on this page are taken from the sections on the player overview pages for simplicity. They follow the same interpretations except are on a per-game basis.
Example: 12/23/16 SAC @ MIN
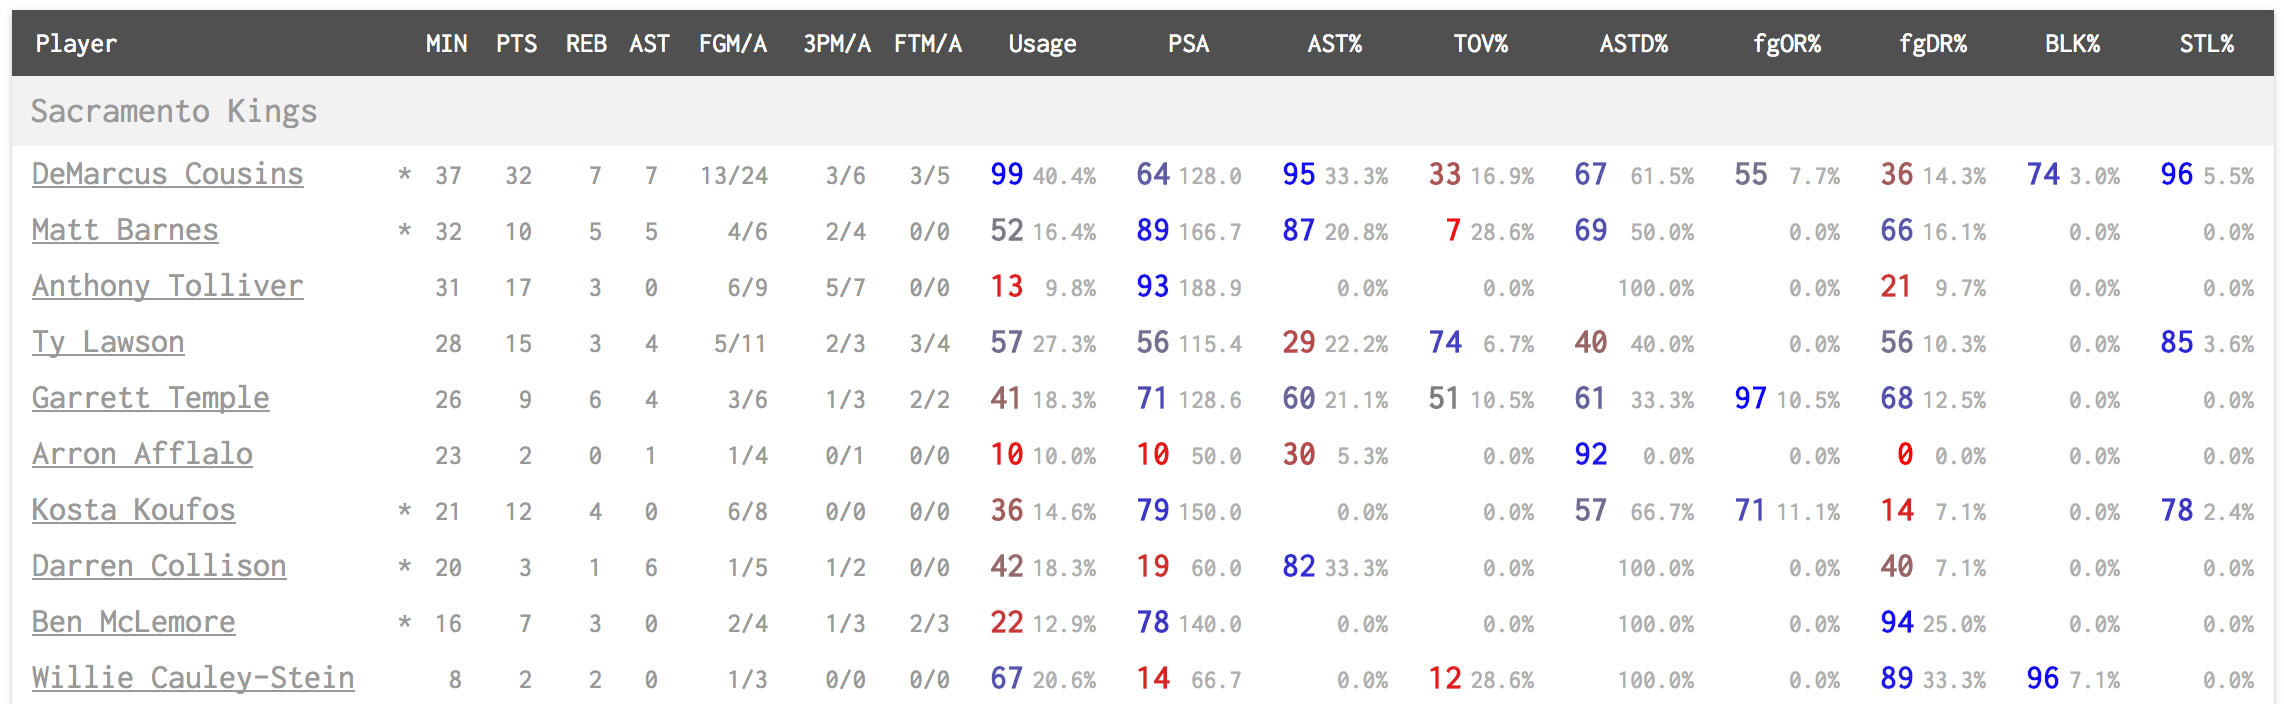
DeMarcus' Cousins' game immediately jumps off the page here. Not only do we see that he had 32 points, 7 rebounds and 7 assists in 37 minutes, but we can scan over and see that the usage rate he had in this game of 40.4% was on the 99th percentile for bigs that season. He shouldered that extreme rate of offense while posting a strong PSA (64th percentile), which is extremely impressive given the amount of offense he used. His assist rate was also sky-high for a big man. His rebounding was underwhelming for his position, but he was very good in both blocks and steals.
Usageclick to show/hide
A player's usage rate attempts to measure how much of a team's offense the player is responsible for. This isn't necessarily a good or bad thing — that depends on whether the player is using that offense efficiently (more on that in a second). But it does give you a sense of how much offensive responsibility the player is shouldering. A player with a very low usage is not creating much on offense (they are more of a role player), while a player with a very high usage is an offensive focal point.
Example: Steph Curry

In the table above, we can see that Steph Curry came into the league with an above-average usage for a point guard, meaning even as a rookie he was fairly involved in the offense. He became a star when his usage jumped over the 90th percentile, before dipping a bit in the 2016-17 season with the arrival of Kevin Durant.
The Gritty Details
CTG calculates usage rate by summing a player's field goal attempts, turnovers, and trips to the free throw line (not counting and-one opportunities), and dividing that by the team's total field goal attempts, turnovers, and free throw trips when the player is on the court. For the purpose of this stat, CTG also splits credit for assists between the passer and the shooter: assisted made field goals only count for half of a normal made field goal, and assists are also credited as half of shot used. One way to think about it: of all the shots and turnovers that happen when the player is on the court, what percentage of them were created by that player?
PSAclick to show/hide
A player's points per shot attempt shows just that: how many points this player scored per attempted shot (with a 2 or 3 shot trip to the foul line also counting as 1 shot attempt). The higher this number, the more efficient the player was when shooting. (This number is displayed per 100 shot attempts so it's easier to read.)
Note that this number is, generally, tied to usage rate, and should be interpreted alongside it. While it's not always true, for most players as their usage increases their efficiency will decrease. It's just difficult to create efficient shots — that's why the best offensive players in the NBA are those that can create these efficient shots even with a high usage. Role players, who have low usage, should find it easier to have a high PSA. They are more selective with their shot attempts and have them created by others more often, so it's easier for them to score efficiently.
Example: Steph Curry
Curry's rookie year was efficient for a guard (81st percentile), but it's really the jump he took the next year, to one of the most efficient guards in the league year-in-and-year-out, that has made Curry the incredible offensive player he is. The biggest key is that he sustained this incredibly high PSA even while his usage has increased.
The Gritty Details
PSA is simply calculated by taking points the player scored (taking out technical free throws) and dividing it by field goal attempts and trips to the foul line (ignoring and-ones). Note that this is essentially the same as the True Shooting Percentage (TS%) stat you may have seen elsewhere. PSA is just TS% times 2. (TS% is divided by 2 to make it look more like a percentage, but CTG uses PSA because PSA is more understandable.)
AST%click to show/hide
A player's assist percentage shows how often the player is assisting teammates. Since a player can only get an assist when his teammate makes a field goal, AST% looks at how many of these teammate made field goals were a result of that player's assists. We can't just interpret this number by itself, since players will, of course, get more assists the more they have the ball. (The next stat, assist to usage ratio, attempts to account for this).
Example: Steph Curry
Curry has generally had an assist rate around average for a point guard. Note that in the 2012-13 season, when Curry split time at the point with Jarrett Jack and therefore is classified as a combo guard, his AST% percentile is much higher (90th) despite having almost an identical AST% to the year prior. As you might guess, combo guards generally have lower assist rates than point guards, which explains the jump.
The Gritty Details
CTG calculates AST% by taking a player's assists and dividing it by the number of his teammates' made field goals when he was on the floor.
ASTD%click to show/hide
Assisted rate tells you how many of a player's made field goals were assisted. CTG breaks this down into locations: all shots, shots at the rim, shots in midrange, and threes. Note that since an assist is only awarded on a made shot, this doesn't tell us how many of a player's shots came off the pass — just his makes. Still, it can be a reasonable way to see how often a player is playing off the pass vs. the dribble.
Note that being assisted more or less isn't necessarily better or worse, but for the purposes of the percentiles CTG says being assisted less often is better (higher number and more blue), since shot creation off the dribble seems to be a rarer and more valued skill. But this should be taken with a grain of salt since it is far from true in all cases.
Example: Steph Curry
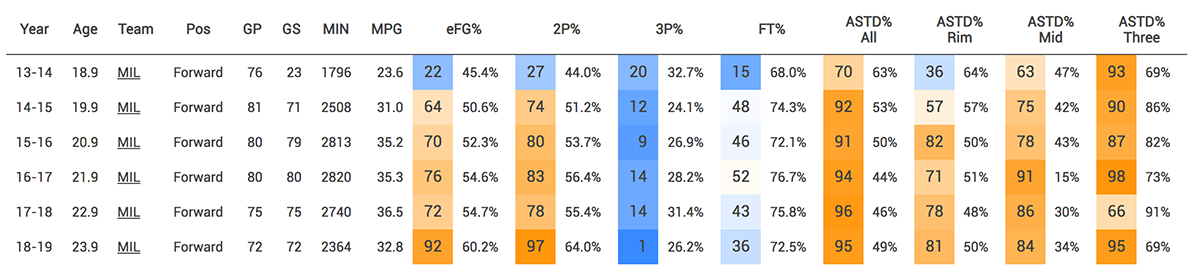
In general, Curry plays off the pass much more than other point guards. This has particularly been the case over the last three seasons, when Steve Kerr took over as head coach and introduced a much pass-heavier offense. Curry, though, generally has had a lower rate of his made threes assisted than other point guards, which makes sense since he's such a good off-the-dribble three-point shooter.
The Gritty Details
This stat simply takes assisted made field goals and divides it by all made field goals.
Rebounding percentages: fgOR%, fgDR%click to show/hide
The only time a player can get a rebound is on a missed field goal or a missed free throw which is the last of a set of free throws. So when we measure how good a player is as a rebounder, we have to take into account how many opportunities he had to get one. Otherwise a player who plays for a team that forces a lot of misses might seem to be a better rebounder than he is. It's not necessarily that he got more rebounds, it's that there were more misses when he was on the court!
That's what these rebounding percentages measure: how often a player got a rebound per opportunity he had to get one. These stats separate out offensive rebounds ("OR") from defensive rebounds ("DR") and missed field goals ("fg") from missed free throws ("ft"). These are all very different rebounding situations, so we should look at them differently. Field goal misses happen much more frequently and are more contested, and therefore when looking at rebounding you should predominantly look at the fgOR% and fgDR% columns.
Example: Steph Curry
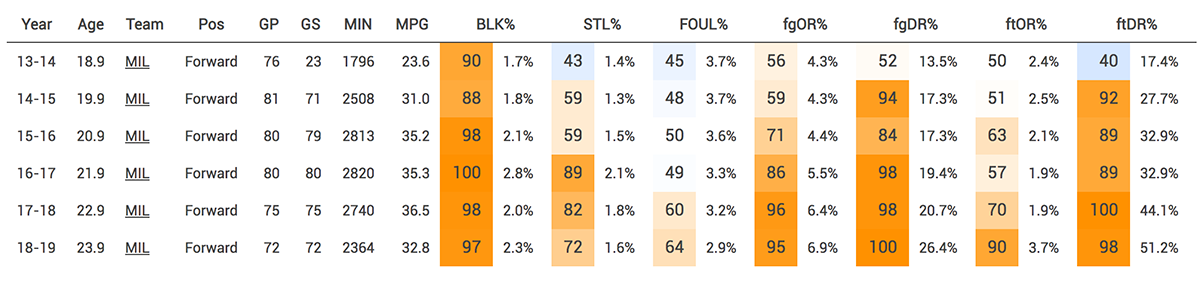
Despite being a small player, Curry has actually been one of the better rebounding point guards on both sides of the ball. He's never ranked below average as a defensive rebounder from field goal misses and has been above average on most years on the offensive side as well. Given that he typically doesn't line up on the blocks on free throws, it's no surprise that Curry gets very few free throw rebounds.
The Gritty Details
CTG calculates rebounding percentages by actually measuring how many misses occur in each category when the player is on the court, and dividing the player's rebounds of each type by his opportunities of each type.
BLK%click to show/hide
Block percentage measures how often the player blocked a shot when an opponent was attempting one.
Example: Steph Curry
Curry has generally not been much of a shot blocker, but most point guards aren't. His numbers aren't that out of line with others at his position.
The Gritty Details
CTG calculates block percentage by dividing a player's blocks by the opposing shot attempts while they are on the court. Shot attempts include all field goals plus shooting fouls drawn (avoiding double counting and-ones). Note that other places you see block percentage sometimes only look at blocks per opposing two-point attempt, and most others do not include opposing fouls drawn in the shot attempts.
STL%click to show/hide
Steal percentage measures how often the player got a steal per play he was on defense. A STL% of 2.0% means that for every 100 defensive plays, the player got 2 steals.
Example: Steph Curry
Curry has always had a high steal rate. This has particularly been the case in recent seasons, even compared to other point guards, typically a high steal group.
The Gritty Details
CTG calculates steal percentage by dividing a player's steals by the defensive plays he was on the court for. A defensive play is a field goal attempt, turnover, or trip to the foul line. Note that other places you see steal percentage often do steals per defensive possession, rather than per defensive play. The differences in these shouldn't be large, but that is why the numbers might not match up.